
Essentially, the P & L report, sometimes referred to as the income statement, reflects financial reports as a major component. This record shows all of the company’s earnings, costs, and expenses within a time frame, usually monthly, quarterly, or end of the year.
Breaking Down the Profit & Loss (P&L) Statement
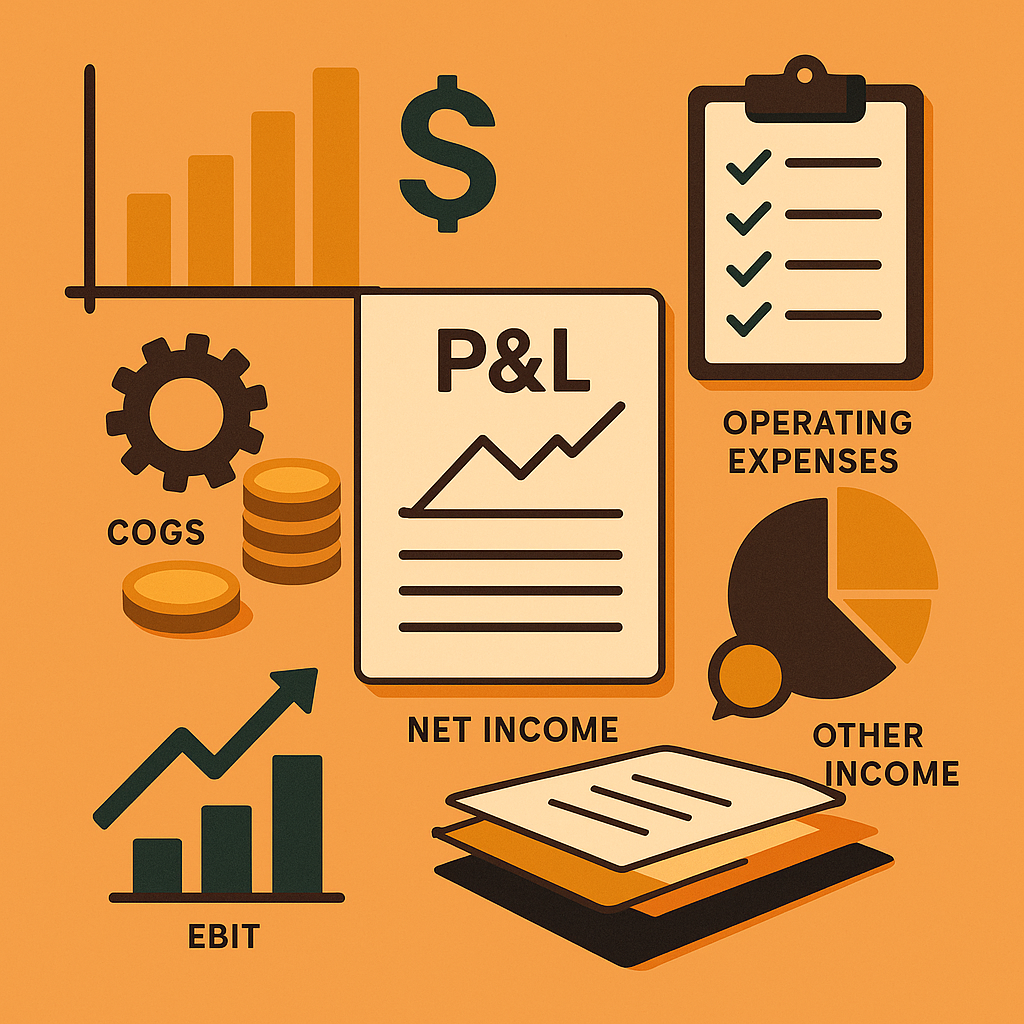
Essentially, the P & L report, sometimes referred to as the income statement, reflects financial reports as a major component. This record shows all of the company’s earnings, costs, and expenses within a time frame, usually monthly, quarterly, or end of the year. The purpose of this statement is to illustrate or state the nature and extent of the effect of revenue generation, cost containment, or both, on generating profits for businesses.
1. Revenues
Revenue is also referred to as the top line. It pertains to the total income that is produced from sales of services or products. For example, the top line in the Profit & Loss report could show that the business has sold all handmade crafts gross before any deductions.
2. Cost of Goods Sold
It provides information of what exactly it costs to produce goods or service sold by your company. It usually includes raw materials, direct labor, and manufacturing cost, added together, it shows COGS.
3. Gross Profit
Gross Profit = Revenue – Cost of Goods Sold. This measure of profit indicates how capable your core business operations are in earning such profit before considering additional expenses or overheads.
4. Operating Expenses
These are costs in the ordinary course of business, such as rent, utilities, salaries (not direct labor), insurance, marketing, and general administrative expenses. This deduction from the Gross Profit will typically give us an operating income.
5. Operating Income (EBIT)
Or colloquially known as EBIT, it stands for Earnings Before Interest and Taxes. It poses the question of how much your business profits from operations alone, without considering the impact of interest or taxes. It is a very good marker of higher-level P&L performance.
6. Other Income and Expenses
Non-recurring expenses or income might be caused by legal settlement gains or extraordinary investments involving one-off events. It might be important to ascertain whether any of them is a one-off, rather than a routine operating item scheduled, because they might influence future long-term profit decisions.
7. Net Income (The Bottom Line)
It’s the last item listed on the profit and loss account; it’s deducted after all expenditure has been subtracted. Indeed, net income has been dubbed as the “bottom line” since it gives the informative point of view-whether the business has made a profit or loss over an accounting period. Positive net income suggests profit while a negative net income implies a loss.
Common Mistakes When Reading Financial Reports & Statements
Any entrepreneur or investor may fall into error in analyzing financial reports. Mistakes that can be committed are:
- An ignorance of the COGS: The cost of sales can be mismanaged and can show profits that are not actually there. Monetary gain is higher in Companies than expenses.
- Normal Things Dictate Changes: Any new thing comes, it follows of itself; for example, sales volume increases by 10 %, and you are likely to have more profit.
- One Time “It” Got Away: One-time income/expenditure is included or excluded without clarification, which alters the interpretation of the financial health.
- Misclassification of cost: if expenditure is incorrectly put in the wrong category, it distorts “P&L,” and tax filing records and financial analysis are all adversely affected.
How to Analyze a P&L Like a Pro
Indeed, once you have got the grip of whatever goes into making up the bottom-line P&L statement, the next step in understanding it involves knowing how to analyze the numbers to make smarter decisions in support of the bottom line. Here’s a basic framework:
1. Trend Analysis
It’s about the comparison of your profit/loss statement from month to month, year on year. An eye would be kept on revenue growth, cost trends, or the changes in some outlay for example has marketing spending resulted into proportional increase in sales? Has the cost of raw materials risen much?
2. Profit Margins Explained
Profit Margins are ratios that help in understanding financial health:
- Gross Profit Margin: (Gross Profit / Revenue) x 100
- Operating Margin: (Operating Income / Revenue) x 100
- Net Profit Margin: (Net Income / Revenue) x 100
Thus, these are the ways of showing how much individual money is retained from one sale.
3. Variance Analysis
They compare true P&L figures against your budget or forecast. They indicate where the major deviations are-below-budget or above-budget areas. A regular analysis on variance helps to fine tune future planning and resource allocation.
4. Break-even Analysis
Naturally, it means what sales should suffice to run all costs without or beyond actual profits. The analysis could establish good measurable sales targets and pricing strategies for the business.
5. Ratios and KPIs
In addition to profit margins, other financial KPIs (including EBITDA (Earnings Before Interest, Taxes, Depreciation and Amortization) and Return on Equity (ROE), the current ratio) can tell you significantly about your business. Not all firms will necessarily need complex ratios, but having a few important ratios known based on strengths of industries will definitively develop great financial literacy.
Importance of Understanding P&L for Small Businesses
You always need to understand your profit and loss accounts–even if you’re not an accountant. Rising and falling business fortunes can be directly connected to how well financial awareness is attained. This is important to understand:
- Master Better Budgeting: Understand the expenses and incomes, which give a better understanding of realistic financial planning.
- Making Data-Driven Decisions: Whether expansion, change in structure, or investment is determined by true data, not hunches, it defines future prospects.
- Comprehensive Evaluation by Lenders/Investors: Being able to explain the reasons for what you do and the logic behind your P&L is the source of trust in stakeholders or investors.
- Early Warning System: This is going to find holes, which might have turned into big dents in the future, in your business’s finance department.
Ready to go beyond profit & loss fundamentals?
You might be reviewing annual financial statements and small initial expenses in keeping with a financial report and statement. Plateau management styles present an opening for entrepreneurs to manage and make a record of how much money has been spent and earn it back.
One does not ask for a financial degree to work wonders; it instead takes the initiative to bring about better business management strategies today.
Best Practices for Creating Financial Reports & Statements
As an individual who’s into content marketing, or even a business owner or analyst, there’s a way of sharpening the manner of reflecting financial information in a report-so people can really get the point across. The best practices will help you create financial reports and documents with greater clarity and utility.
1. Define Your Objective
Every report should be designed with a definable intention in mind. Is this report going to be for internal performance review, investor relations, or budget planning? This question pretty well determines layout, extent of detail, and even terms to be used in preparing your reports.
2. Keep It Structured and Standard
Achieving consistency as well as standardization across all financial reports & statements translates into improved readability and comparability over a period. Standardized templates must be used in creating your income statements, balance sheets, and cash flow reports in order to make them intelligible and more importantly, capable of evaluation by stakeholders. Headers, categories, and dates adhere to either GAAP or IFRS if applicable.
3. Make it Visually Informative
The most natural way to convey trends and comparisons is through graphs, tables, and charts-so a set of numbers can visually be translated, showing a trend from a low to peak number without you having to read very much or interpret the results through a table of values. Think of a line graph which also shows an improvement in revenue over the previous quarter or quarters added to the number on paper.
4. Fresh and Factual Data Usage
Data integrity is necessary for the effective use of financial reports & statements. One of the many problems of erroneous data is leading readers astray and may cause disastrous decision-making. Ensure datasets are automatically captured where possible and the data validated before sharing or publishing the doc.
5. Provide Insight on Anomalies and Trends
One shouldn’t leave your readers guessing because there was a sudden dip in profits or a significant increase in expenses. Users need a summary note or a note section for each data section where data points look unusual. It helps in achieving transparency plus makes surprise audits unnecessary-at least if the readers are team members, investors, or any outsourced auditor.
Common Mistakes to Avoid
As important as following best practices, avoiding common mistakes is equally important. To help ensure that financial reports are accurate and user-friendly, avoid the following:
- Using a lot of jargon: In particular, it is important to keep the explanation of understanding P&L in the language of ordinary explainers. Change or define intricate terms for those non-financial stakeholders.
- Inconsistent time frames: No clear nomenclature for monthly, quarterly, and annual data may lead you to mix data across those periods and mislead inaccurate analysis.
- The absence of attention to cash flow: Most put the biggest focus on profits and loss, yet sometimes one forgets the cash flow statement as lack may veil liquidity issues that impact day-to-day activities.
- Outdated models of templates are not kept up to date: Old formats may differ from actual standards or fail to possess novel line items. Occasional inspections prevent this.
Case Study: Using Financial Reports & Statements to Drive Growth
Imagine envision for yourself a mid-size eCommerce company pursuing scaling of its operations. It began with absorbing a thorough quiz for its financial documents. The team realized an increase in revenue and stagnation in profitability. Indeed, delving into the detailed monthly P&L statements revealed huge fulfillment costs that eat into margins.
A 15% reduction in costs was made possible over the following 2 quarters by a revision of supply chain management combined with restructured vendor contracts. In addition, informed marketing campaigns based on customer lifetime value calculated from financial reports and statements can improve overall ROAS (Return on Ad Spend).
So this is an application of financial statement usage with how one looked at P&Ls thoughtfully and smartly makes the intelligence in business.
Tools That Support Accurate Financial Reporting
Leverage on the right tools for creating and analyzing financial reports and statements in a simpler way below are some of the commonly used platforms.
- QuickBooks: Ideal for small to midsize businesses, providing P&L reports, balance sheets adn also permits customizations to disastrous dashboards.
- Xero: Xero, characterized as user-friendly and enriched with strong data pace integration, making users get an in-depth financial understanding.
- Google Sheets, even with Templates: It is an excellent time to invest in this for start-up businesses or to guide information and how-to creators, active for just unfussy and economical reporting.
- Power BI or Tableau: These two are most proficient in handling huge data sets and feature immersive visual displays.
Selecting the right platform depends on the size of the business, technical skill level, as well as the complexity of financial transactions With any of these, make certain that they provide for real-time tracking, a capable exporting mechanism, and customization of views for different users.
Aligning Financial Reports with Content Strategies
Financial reports and statements, in the context of content that provides informational know-how, can tell you what to focus on in your content. Following this, you should understand the trade category or articles that leads to the highest conversion or product interest and can influence you to put your money in strategic investment in more like types of contents. Additionally, the evaluation of P&L performance in relation to SEO or paid campaigns can facilitate content teams to concentrate on high-retention topics.
Thus, the integration of financial data and strategic content planning leads to measurable business growth and stronger audience engagement.
Mastering Financial Reports & Statements: A Complete Guide
Understanding the fiscal health of your company begins with this one essential skill: the ability to read and understand your financial reports and statements. In the most general sense, all forms of accounting and decision-making are based on financial documents. Whether you are a senior entrepreneur or starting off, the command over P&L (Profit and Loss) will significantly bring your financial vision into perspective and better planning accuracy. In this last part of the guide, we’ll be discussing practical insights, expert resources, frequently asked questions, and a strong call to action for what your next confident steps should be.
Bringing It All Together: Using Financial Reports to Drive Strategy
So now that the structure and importance of financial reports and statements had been discussed, it was time to think about applying them into strategic positions within the business. These pieces which include the P&L, which is Profit and Loss Statement, Balance Sheet, and Statement of Cash Flows, lie in the foreground of presenting the well-structured financials of a company to its followers because then any single one of this does not answer the questions but the internal combinations provide a ticket right through to response. The three taken together can offer hints into revenue trends, cost structure, and operational efficiency. For instance, if you keep eye on them regularly—on monthly, quarterly, or annual basis-it helps business people to gauge their profits, find out bloat in expenses, as well as rectify cash flow issues immediately. Understanding whether or not your P&L makes money for you is by far not the main point, what helps you more is that it causes you to search for the reasons behind those numbers, not only in warehousing costs but also in terms of operating expenses. For instance, will sales and admin be out of proportion or, is the cost of goods increasing now faster than revenues, do they suggest the permanence of higher future selling and admin expenses? Digging into an analysis of the P&L statement will help you identify these key components, giving you answers before such could have further injured your bottom line.
When to Seek Professional Help
Although many small business owners can take care of the analysis of their financial information, there comes a time where hiring a professional is the best option. Poor financial reporting or incorrect conclusions might end up in costly decisions penalties, and missed opportunities. So, the service of a bookkeeping professional is not only to comply but also to plan forward. This must entail planning forward when considering growth and profitability.
Maikai Bookkeeping Services has specialized in simplifying and decoding financial reports and statements for business owners to understand and act meaningfully. We deliver highly customized services in P&L analysis services and boast reviews that go in-depth, thus playing a vibrant role for the industries in data-driven decisions.
Tools and Templates to Get You Started
Oh, one before we dive into our frequently asked questions, just a few quick wins you can apply directly right now:
- A Profit and Loss template: a straightforward form that allows you to better log and track all of your income and expense information.
- Software Programs for Accounting: Even popular products like QuickBooks and Xero can automate much of the manual process so you can just get run reports.
- eLearning, source through tutorials, and deep dives on Investopedia so that one can have an idea on additional concepts about it: medium blog, Forbes.
For additional reading, check out:
- Top Financial Metrics Every Small Business Should Track
- Startup Bookkeeping: What You Need to Know
- Bookkeeping vs. Accounting: What’s the Difference?
Frequently Asked Questions
Financial reports & statements is a strategy or concept used to improve understanding P&L through structured and intentional methods.
It improves performance by aligning your content with search behavior and industry best practices.
Absolutely, even complete novices can effectively implement these principles given the proper support structures and tools.
Start with Google Search Console, SEMrush, and keyword research tools. These help you understand how financial reports & statements impacts your performance.
Next Steps
Now that you’ve developed foundational knowledge of financial reports & statements and improved your understanding P&L, take the next step toward financial clarity. At Maikai Bookkeeping Services, we offer one-on-one consultations to break down your profit and loss in detail, helping you move forward with insight and confidence.
📣 Ready to take full control of your finances? Schedule your P&L breakdown consult today and transform your financial strategy with clarity and confidence.